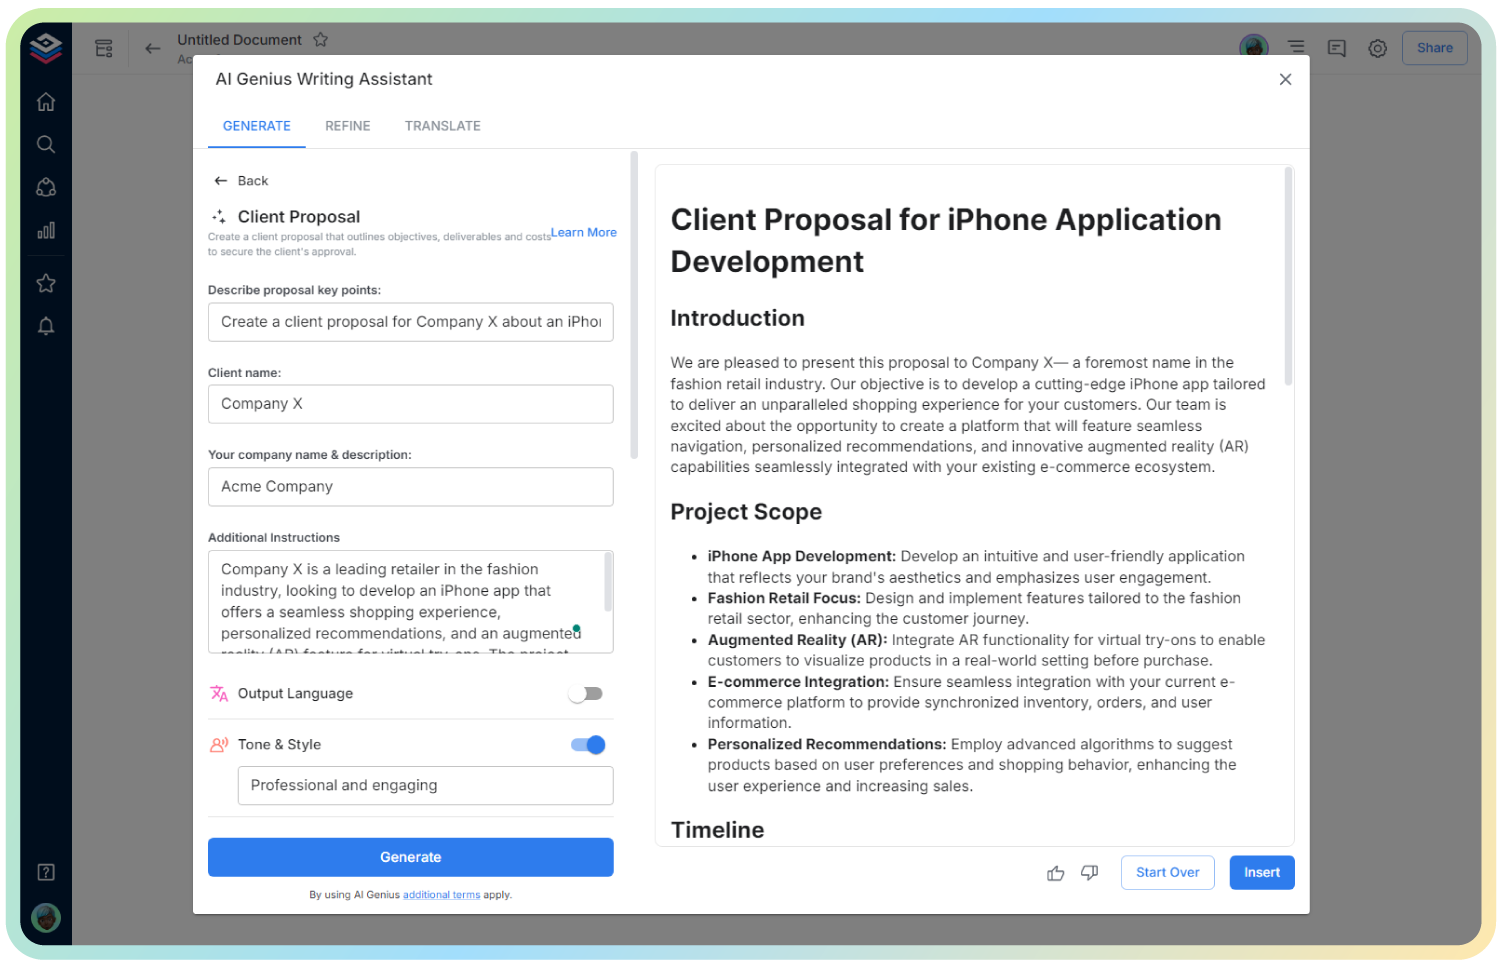
AI Analytics Report
Your Key to the Best Data-Driven Decisions
All of us are aware that making informed decisions is crucial for success. Enter Bit.ai’s Analytics Report Tool! This powerful solution enables you to transform complex data into clear, actionable insights that drive your strategy forward—without the overwhelming spreadsheets.
Ready to use the power of data for your business? Let’s explore how Bit.ai’s Analytics Report Tool can elevate your decision-making process and enhance your operational efficiency!
What is the Analytics Report?
Think of it as your personal data analyst! The Analytics Report Tool compiles and analyzes data from various sources, presenting it in a visually engaging format. This tool ensures you can quickly grasp trends, performance metrics, and key insights that guide your business decisions. It’s like having a compass that points you in the right direction based on hard evidence!
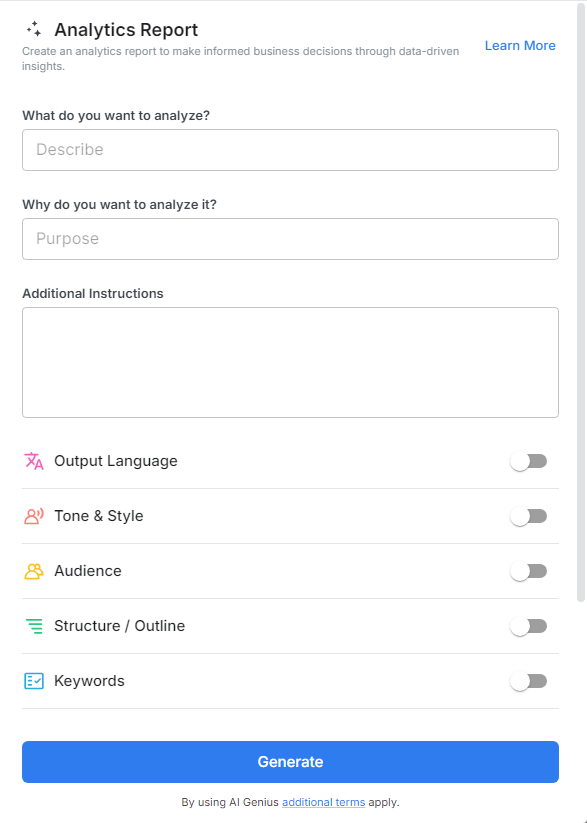
Why Use the Analytics Report?
- Data Visualization: Transform raw data into stunning visuals such as charts and graphs, making it easier to comprehend and communicate findings to your team and stakeholders.
- Identifies Trends and Patterns: The tool helps you spot trends over time, allowing you to anticipate market shifts and adapt your strategy accordingly.
- Enhances Decision-Making: By providing a clear view of your data, the Analytics Report Tool empowers you to make informed decisions backed by solid evidence, minimizing guesswork.
- Saves Time and Resources: Automating the data collection and reporting process frees up valuable time for your team, allowing them to focus on strategic initiatives rather than data crunching.
- User-Friendly Interface: Designed for all levels of users, Bit.ai’s tool simplifies the reporting process, making it accessible even for those without extensive analytical experience.
Why Use Bit.ai for Analytics Reporting?
Bit.ai’s Analytics Report Tool offers robust features that enhance your reporting capabilities. Here’s why it should be your go-to solution for generating insightful reports:
- Comprehensive Data Integration: Seamlessly connect with various data sources, whether it’s social media metrics, sales figures, or website analytics, to compile all your insights in one place.
- Customizable Templates: With a variety of pre-designed templates, you can easily create professional reports that reflect your brand’s identity while presenting data clearly and effectively.
- Collaborative Features: Involve your team in the reporting process! Bit.ai supports real-time collaboration, enabling team members to contribute insights, comments, and suggestions directly within the report.
- Actionable Insights: Beyond just data presentation, the tool helps highlight actionable insights and recommendations based on your data, guiding your strategy effectively.
- Cloud-Based Accessibility: Access your reports from anywhere, ensuring that you and your team can review insights and make decisions on the go, enhancing agility.
- Consistent Branding: Maintain a uniform look across all reports with reusable templates that ensure brand consistency while being adaptable to different reporting needs.
How to Use Bit.ai’s Analytics Report
1. Open a new document in Bit.ai.

2. Type @ on a blank line to open up the AI Writing Assistant.

3. Search Instagram Post Generator from the template search field on the left sidebar.
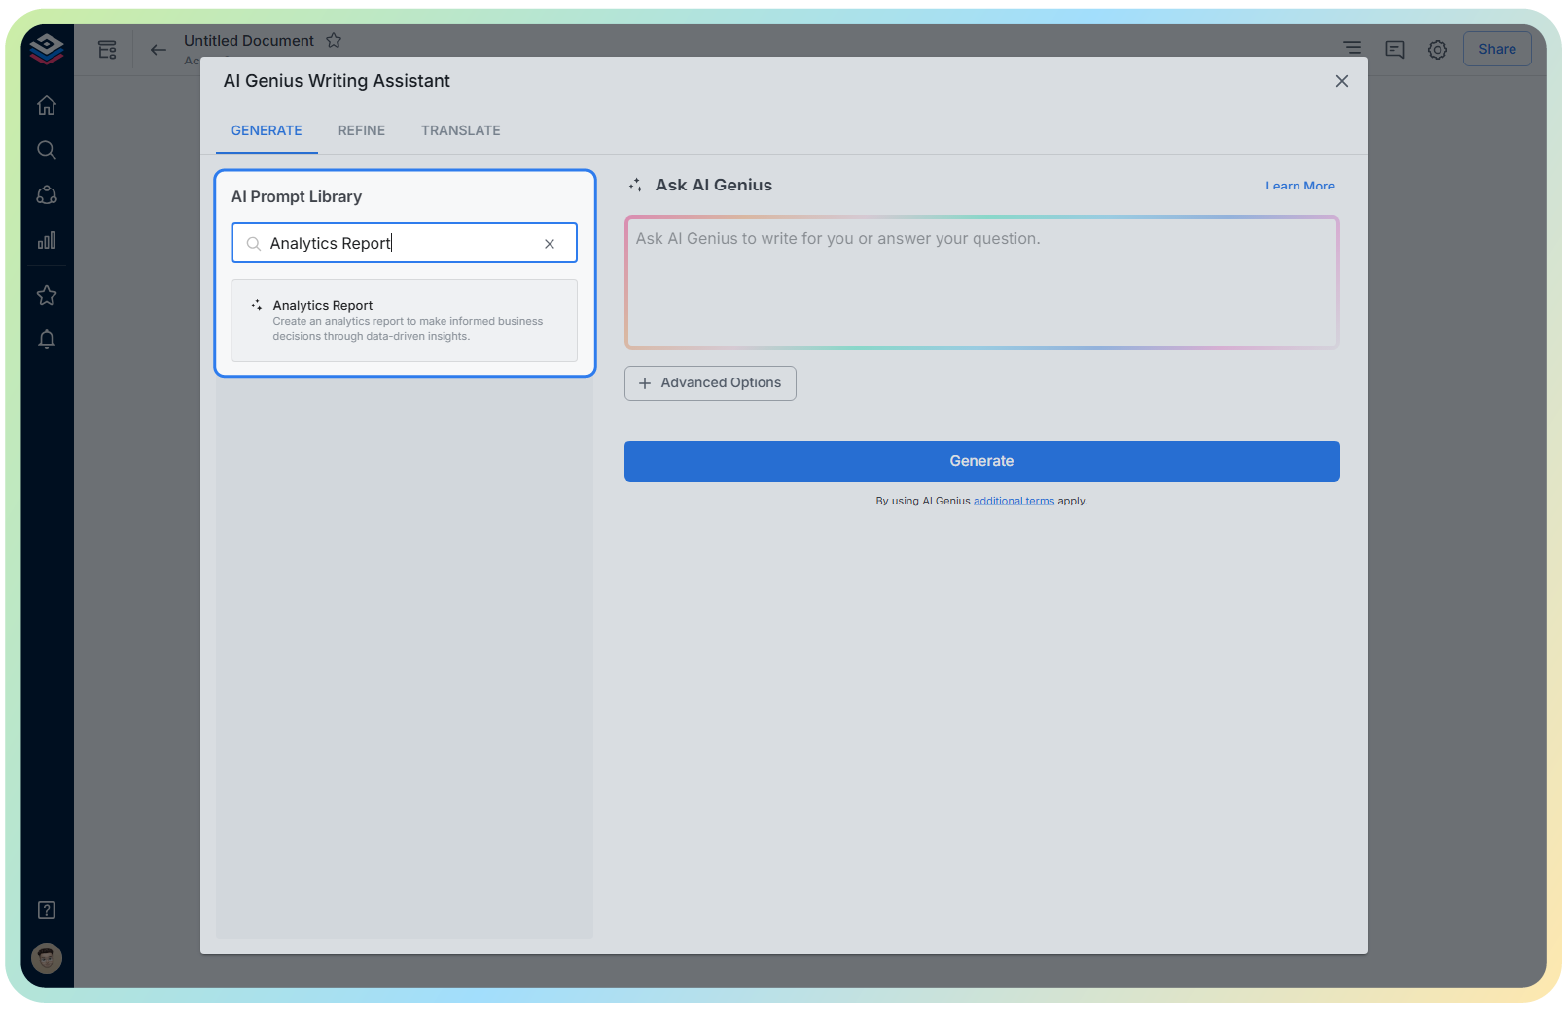
4. Fill out the quick Instagram Post Generator entry form, and Bit.ai will generate a customized post.

5. Utilize ‘Advanced Options’ to tailor the report based on specific insights or organizational goals.

6. Click ‘Insert,’ and your analytics report will be added to your document for easy reference.